How to Read an ECG: A Systematic 10-Step Approach
How to Read an ECG, A fixed reading sequence, the normal values that anchor it, and the high-risk patterns that are missed precisely because the obvious abnormality was found first.
Most ECG errors are not errors of knowledge. The clinician who misses a prolonged QT usually knows the normal range perfectly well; they simply stopped looking once they had found the atrial fibrillation. Cognitive psychologists call this satisfaction of search, and the electrocardiogram is an almost perfect trap for it, because it presents twelve simultaneous views of a three-dimensional electrical event on a single sheet of paper and rewards the eye that jumps straight to the striking finding.
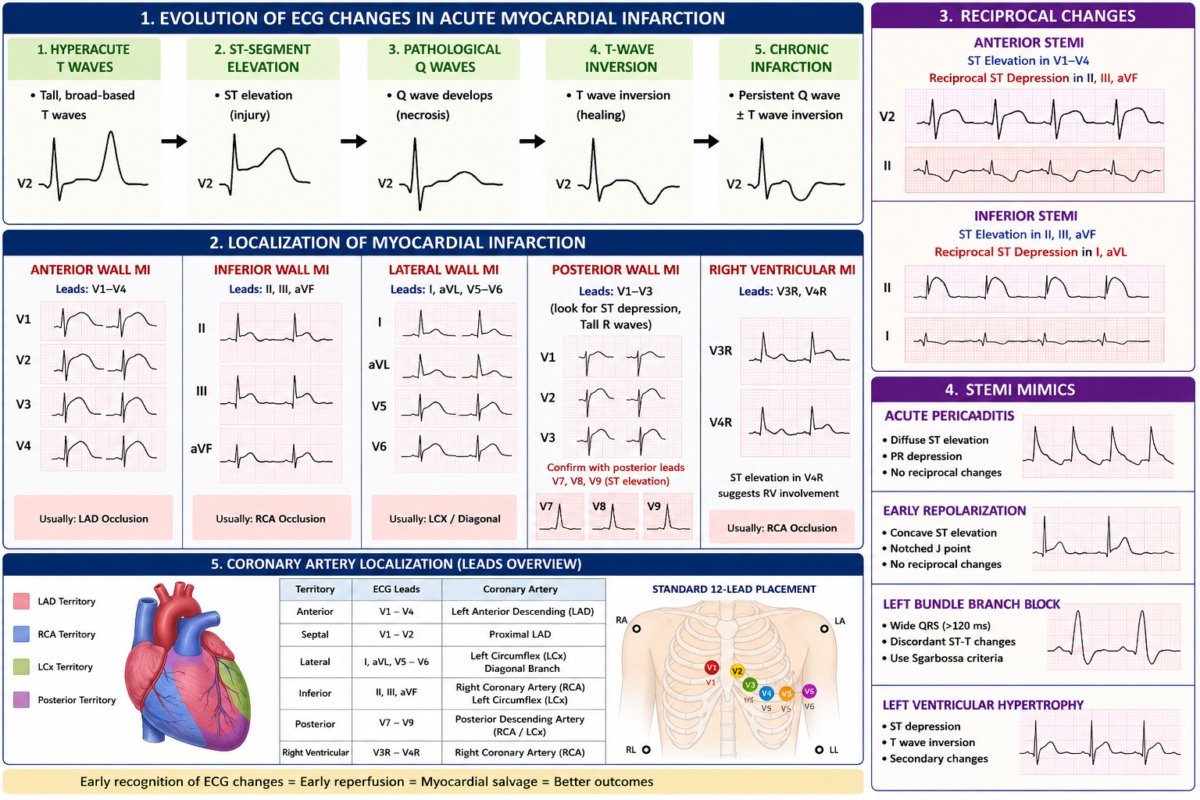
The only reliable defence is a fixed sequence, performed the same way every time, including on the tracings that look normal at a glance — and particularly on those. What follows is a ten-step method with the reference values at each stage. Read it alongside our companion article on ECG changes in acute myocardial infarction, which covers the evolution, localisation and reciprocal changes of infarction in depth.
Step 1: How to read ECG-Verify the Technical Basics Before Interpreting Anything
This step is skipped almost universally and accounts for a meaningful share of misdiagnosis. Before any interpretation, confirm three things.
Calibration and speed. Standard settings are 25 mm/s paper speed and 10 mm/mV gain, marked by the calibration pulse at the start of the trace. At half standard gain, voltage criteria for hypertrophy become meaningless; at 50 mm/s, every interval appears doubled. Machines are routinely left on non-standard settings after a paediatric or tachycardia study.
Lead placement. Limb lead reversal is common and produces striking pseudo-pathology. Right arm and left arm reversal generates a negative P wave and QRS in lead I with global negativity — mimicking dextrocardia, though the precordial progression stays normal, which distinguishes it. Precordial leads placed too high in the second or third intercostal space produce poor R wave progression and can manufacture an anteroseptal infarct pattern that vanishes on repeat.
Artefact. Tremor, shivering and poor electrode contact can convincingly imitate atrial flutter or ventricular tachycardia. The reassuring feature is that genuine QRS complexes usually march through the artefact at their own regular rate — find them, and the diagnosis resolves.
Step 2: Rate
For a regular rhythm, divide 300 by the number of large squares between successive R waves, which yields the familiar sequence 300, 150, 100, 75, 60, 50. For an irregular rhythm this method is invalid; instead count the QRS complexes across a 6-second strip and multiply by ten.
Assess atrial and ventricular rates separately whenever they may differ. In complete heart block, second-degree block and atrial flutter, a single reported rate discards the essential information.
Step 3: Rhythm
Answer four questions in order, and the rhythm resolves itself in the great majority of tracings.
| Question | What it establishes |
|---|---|
| Is it regular? | Irregularly irregular suggests AF, multifocal atrial tachycardia, or frequent ectopy |
| Are P waves present? | Absence with an irregular rhythm points to AF; sawtooth suggests flutter |
| Is every P followed by a QRS, and every QRS preceded by a P? | Establishes AV relationship and identifies block |
| Is the QRS narrow or broad? | Narrow implies supraventricular origin; broad requires exclusion of VT |
On broad complex tachycardia, the governing principle is clinical rather than electrocardiographic: assume ventricular tachycardia until proven otherwise, particularly in a patient with structural heart disease or prior infarction, where the pre-test probability exceeds 90 per cent. Features favouring VT include AV dissociation, capture and fusion beats, QRS duration beyond 160 ms, and extreme axis deviation. Haemodynamic stability is not a discriminating feature and has caused real harm when treated as one.
Step 4: Axis
The quickest reliable method uses leads I and aVF. Both positive indicates a normal axis; lead I positive with aVF negative indicates left axis deviation, which should then be checked against lead II — if lead II is also negative, the deviation is genuine and beyond −30°. Lead I negative with aVF positive indicates right axis deviation, and both negative indicates extreme axis.
| Axis | Range | Common causes |
|---|---|---|
| Normal | −30° to +90° | Normal Axis |
| Left axis deviation | −30° to −90° | Left anterior fascicular block, inferior MI, LVH, mechanical shift |
| Right axis deviation | +90° to +180° | Left posterior fascicular block, RVH, pulmonary embolism, lateral MI, normal in tall thin young adults |
| Extreme axis | −90° to ±180° | Ventricular rhythms, hyperkalaemia, lead reversal |
Step 5: P Waves and Atrial Abnormality
A normal P wave is under 120 ms wide and under 2.5 mm tall, upright in leads I, II and aVF, and inverted in aVR.
Left atrial abnormality produces a notched P wave in lead II exceeding 120 ms, or a terminal negative deflection in V1 at least 1 mm deep and 40 ms wide. It commonly accompanies mitral valve disease, hypertension and heart failure with preserved ejection fraction, and supports elevated filling pressures when the echocardiogram is equivocal.
Right atrial abnormality produces a P wave of 2.5 mm or more in lead II, classically with pulmonary hypertension, tricuspid disease or chronic lung disease.
Step 6: How to read ECG- PR Interval and AV Conduction
Normal is 120 to 200 ms. Beyond 200 ms defines first-degree AV block, which is not benign in all contexts — marked prolongation beyond 300 ms can produce symptoms through loss of AV synchrony. Below 120 ms with a delta wave and broad QRS indicates ventricular pre-excitation, and the recognition matters urgently: in pre-excited atrial fibrillation, AV nodal blocking agents may accelerate conduction down the accessory pathway and precipitate ventricular fibrillation.
For second-degree block, distinguish Mobitz I, with progressive PR lengthening before a dropped beat and usually a benign nodal course, from Mobitz II, with constant PR intervals and sudden dropped beats, which is infranodal, unstable and an indication for pacing.
Step 7: QRS Complex
Duration and bundle branch block
A QRS of 120 ms or more requires an explanation. Right bundle branch block shows an rSR′ pattern in V1 with a broad slurred S wave in leads I and V6. Left bundle branch block shows a broad notched or slurred R wave in leads I, aVL, V5 and V6 with absent septal Q waves laterally. New left bundle branch block in the context of ischaemic symptoms warrants urgent attention, and where infarction must be diagnosed in its presence, the Sgarbossa criteria apply: concordant ST elevation of 1 mm or more scores 5 points, concordant ST depression of 1 mm or more in V1 to V3 scores 3, and excessively discordant ST elevation of 5 mm or more scores 2, with a total of 3 or more being highly specific. Smith’s modification replaces the absolute 5 mm rule with an ST/S ratio of −0.25 or less, which improves sensitivity substantially and is the version most useful at the bedside.
Voltage and hypertrophy
| Criteria | Threshold |
|---|---|
| Sokolow-Lyon (LVH) | S in V1 + R in V5 or V6 ≥ 35 mm |
| Cornell voltage (LVH) | R in aVL + S in V3 > 28 mm (men), > 20 mm (women) |
| R in aVL alone | > 11 mm |
| RVH | R > S in V1, right axis deviation, R in V1 > 7 mm |
Voltage criteria are specific but insensitive, and they perform poorly in obesity, chronic lung disease and pericardial effusion, where the whole tracing is attenuated. Supporting features — left atrial abnormality, a strain pattern of downsloping ST depression with asymmetric T inversion in the lateral leads, and left axis deviation — strengthen the diagnosis considerably.
Q waves and R wave progression
Pathological Q waves exceed 40 ms in width or 25 per cent of the ensuing R wave amplitude. In the R wave progression across the precordium, the transition from predominantly negative to predominantly positive normally occurs between V3 and V4; delayed progression suggests prior anterior infarction, though lead misplacement and body habitus must be excluded first.
Step 8: ST Segment
Compare the ST segment against the TP segment as baseline rather than the PR segment, which is itself displaced in pericarditis. Then characterise any deviation by shape, because morphology carries more information than magnitude. Convex or straightened upward elevation suggests ischaemia; concave elevation is more typical of pericarditis or benign early repolarisation. Downsloping or horizontal depression is more concerning than upsloping depression, which is frequently rate-related.
Crucially, look for reciprocal change. ST elevation with reciprocal depression in an anatomically opposite territory is strongly suggestive of occlusion; its absence should prompt consideration of pericarditis, early repolarisation or another mimic. Our companion article on ECG changes in acute myocardial infarction sets out the territorial mapping and coronary correlation in full.
Step 9: T Waves, U Waves and the QT Interval
T waves are normally concordant with the QRS, upright in most leads, and inverted in aVR. Isolated inversion in V1 and in lead III is usually normal, as is the persistent juvenile pattern through V1 to V3 in some young adults. Deep symmetric inversion is the pattern that demands explanation.
Measure the QT in the lead where it is longest, typically V2 or V3, and correct for rate. Bazett’s formula remains standard for clinical purposes and over-corrects at high rates. Prolongation beyond roughly 450 ms in men and 460 ms in women is abnormal, and beyond 500 ms carries a materially increased risk of torsades de pointes. Given how many prescribed drugs prolong the QT — antiarrhythmics, macrolides and fluoroquinolones, antipsychotics, ondansetron, methadone — and how often they are combined with hypokalaemia or hypomagnesaemia, this is the interval most likely to be clinically actionable and most often left unmeasured.
Prominent U waves suggest hypokalaemia; they merge with the T wave as the potassium falls and can make the QT appear artificially prolonged.
Step 10: How to read ECG – final step- Compare, Synthesise and State the Clinical Question
Finish by placing the findings against the clinical context and the previous tracing. An ECG interpretation that reads “sinus rhythm, LVH, lateral T inversion” is incomplete; one that reads “sinus rhythm with LVH and lateral repolarisation change, new since 2024, in a patient with exertional chest pain — ischaemia cannot be excluded and further evaluation is indicated” is a clinical act rather than a description.
Patterns You Cannot Afford to Miss
| Pattern | Recognition | Significance |
|---|---|---|
| de Winter | Upsloping ST depression at the J point with tall symmetric T waves in the precordial leads | Proximal LAD occlusion; static, does not evolve into elevation |
| Wellens | Deeply inverted or biphasic T waves in V2–V3, recorded pain-free | Critical proximal LAD stenosis; stress testing is hazardous |
| aVR elevation | ST elevation in aVR with widespread ST depression | Left main or proximal LAD disease, or severe triple-vessel disease |
| Posterior infarction | Tall R waves and ST depression in V1–V3; confirm with posterior leads V7–V9 | Often missed entirely as no elevation appears on the standard 12 leads |
| Brugada type 1 | Coved ST elevation ≥ 2 mm in V1–V2 with negative T wave | Risk of sudden cardiac death; unmasked by fever and sodium channel blockers |
| Hyperkalaemia | Peaked T waves → P wave flattening and PR prolongation → QRS widening → sine wave | Progression can be rapid; treat on the ECG, not the awaited laboratory result |
| Pre-excited AF | Irregular, broad, polymorphic complexes at very high rates | AV nodal blockers are contraindicated and may precipitate VF |
The unifying theme is that conventional millimetre criteria for ST elevation identify only a proportion of acutely occluded arteries. Whether the field ultimately replaces the STEMI/NSTEMI framework with one based on occlusion remains a matter of active debate, but the practical implication is settled and independent of terminology: a patient with ongoing ischaemic symptoms and a non-diagnostic tracing needs serial ECGs, posterior and right-sided leads where indicated, and a low threshold for urgent angiography.
Errors Worth Naming
Trusting the machine interpretation. Automated algorithms are reasonable at rate and interval measurement and unreliable at rhythm and ischaemia. Their most dangerous failure mode is a confidently normal report on a subtly abnormal tracing, because it anchors the reader before they have looked.
Stopping at the first abnormality. The atrial fibrillation is found and the long QT beneath it is not. The fixed sequence exists to prevent exactly this, which is why it must be completed even after something significant has been identified.
Reading the ECG without the patient. The same tracing means different things in a 24-year-old athlete and a 74-year-old diabetic with epigastric pain. Pre-test probability legitimately shifts interpretation, and pretending otherwise is not objectivity.
Failing to repeat. A single tracing is a snapshot of a dynamic process. In ongoing symptoms with a non-diagnostic ECG, repeating at 15 to 30 minute intervals converts a static image into a trajectory, which is frequently where the diagnosis becomes visible.
Build the pattern library
A systematic method tells you where to look; recognising what you find requires exposure to many tracings. ECG Quick Notes: From Beginner to Expert works through the full range of patterns with annotated tracings — arrhythmias, conduction disease, ischaemia, electrolyte and drug effects, and the inherited syndromes — structured for residents, fellows and physicians reading their own ECGs.
References
Sgarbossa EB, et al. Electrocardiographic diagnosis of evolving acute myocardial infarction in the presence of left bundle-branch block. N Engl J Med. 1996.
Smith SW, et al. Diagnosis of ST-elevation myocardial infarction in the presence of left bundle branch block with the ST-elevation to S-wave ratio. Ann Emerg Med. 2012.
de Winter RJ, et al. A new ECG sign of proximal LAD occlusion. N Engl J Med. 2008.
de Zwaan C, Bär FW, Wellens HJ. Characteristic electrocardiographic pattern indicating a critical stenosis high in the left anterior descending coronary artery. Am Heart J. 1982.
This article is intended for qualified healthcare professionals and postgraduate trainees. Electrocardiographic interpretation must always be integrated with clinical assessment; no criterion listed here is a substitute for clinical judgement.